|
|
|
|
|
|
|
|
|
|

 Zoom Zoom
 | Loading… |
|
|
Employs
Run Anywhere
technology to support user access on any smartphone, tablet or desktop. Automatically recognizes touch user interfaces.
|
|
|
|
|

 Zoom Zoom
 | Loading… |
|
|
A
View
is a window into a specific business function that is critical to your organization. Each
View
is a separate collection point for common reporting data.
|
|
|
|
|

 Zoom Zoom
 | Loading… |
|
|
The input for reporting data is a
Web Service API
. This provides access to any Operating System, using any programming language, from any location.
|
|
|
|
|
 Zoom Zoom
 | Loading… |
|
|
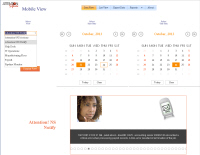
Scan View:
The primary choice for users with touch-enabled devices. Pick a starting and ending time, and the appropriate View, then use
touch navigation
to receive a quick synopsis of enterprise activity; as easy as scanning through a photo album.
|
|
|
|
|
 Zoom Zoom
 | Loading… |
|
|
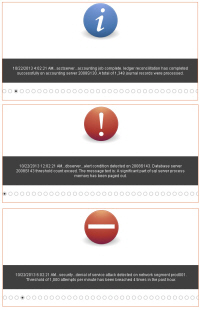
Scan View:
Receive
status at a glance
by associating messages with meaningful graphics.
|
|
|
|
|
 Zoom Zoom
 | Loading… |
|
|
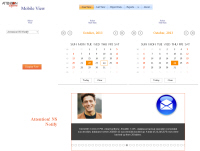
Scan View:
Customize the graphics
to meet the needs of your organization. Sometimes a descriptive picture is worth many words.
|
|
|
|
|
 Zoom Zoom
 | Loading… |
|
|
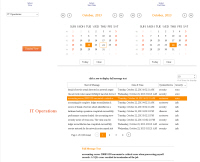
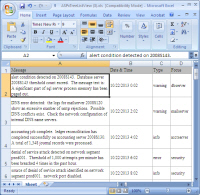
List View:
Adjust the display based on the
viewing area
of your current device.
Sort by the desired column
, and use the
Focused Row
feature to view the complete message text.
|
|
|
|
|
 Zoom Zoom
 | Loading… |
|
|
Export
the raw reporting data to the format of your choice, including XLS, XLSX, PDF and RTF.
|
|
|
|
|
 Zoom Zoom
 | Loading… |
|
|
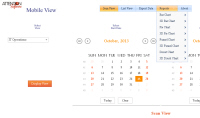
Reports:
Sometimes the best way to analyze data is in a graphical format, and people have their own ideas on which format is best.
Eight (8) Chart types
are available to address the needs of your organization.
|
|
|
|
|
 Zoom Zoom
 | Loading… |
|
|
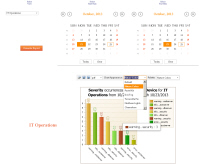
Reports:
Users choose from a wide selection of colors to tailor the
Chart Appearance
and
Palette
to suit their taste.
|
|
|
|
|
 Zoom Zoom
 | Loading… |
|
|
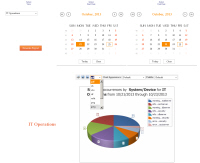
Reports
: Once the Chart is generated, it is easy to
Export
to the desired format,
Display
on the screen or
Print
for later review.
|
|
|
|
|
 Zoom Zoom
 | Loading… |
|
|
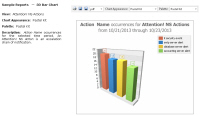
Sample Report:
3D Bar Chart
depicting IT events that resulted in the firing of notification escalation chains.
|
|
|
|
|
 Zoom Zoom
 | Loading… |
|
|
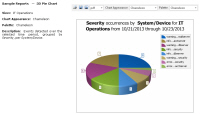
Sample Report:
3D Pie Chart
representing System/Device messages, grouped by the Severity of the message.
|
|
|
|
|
 Zoom Zoom
 | Loading… |
|
|
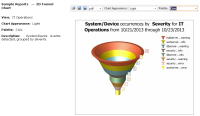
Sample Report:
3D Funnel Chart
representing System/Device messages, grouped by the Severity of the message.
|
|
|
|
|
 Zoom Zoom
 | Loading… |
|
|
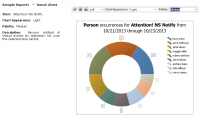
Sample Report:
2D Donut Chart
representing people notified of alert conditions over a 2-day period.
|
|
|
|
|
 Zoom Zoom
 | Loading… |
|
|
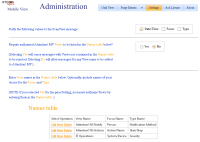
The web accessible
Administration
application provides a simple and effective means to tailor the reporting interface, and perform periodic database maintenance.
|
|
|
|
|
 Zoom Zoom
 | Loading… |
|
|
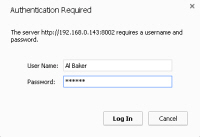
The level of
login security
is the choice of your organization. Choose from Anonymous, Basic or Windows authentication.
|
|
|
|
|

 Zoom Zoom
 | Loading… |
|
|
The Web Service API supports secure, encrypted network communication using
Secure Socket Layers
.
|
|
|